Here are a few Facebook posts I made during the storm.
984 millibars, new low. Looking at the window at Roosevelt Island which has been breeched by the East River, the lighthouse at the end of the island is now mid river.
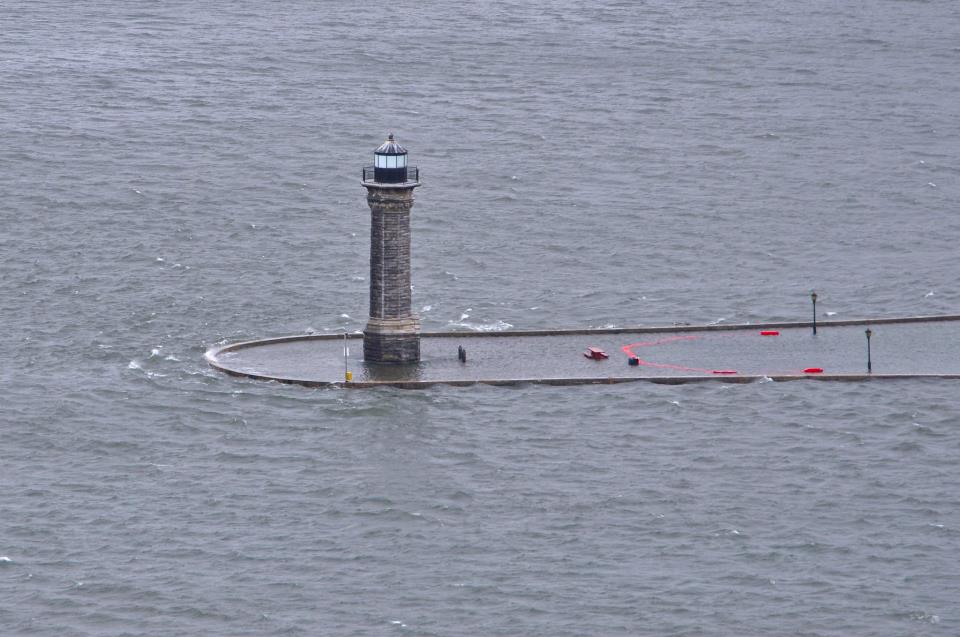
View out window of east river
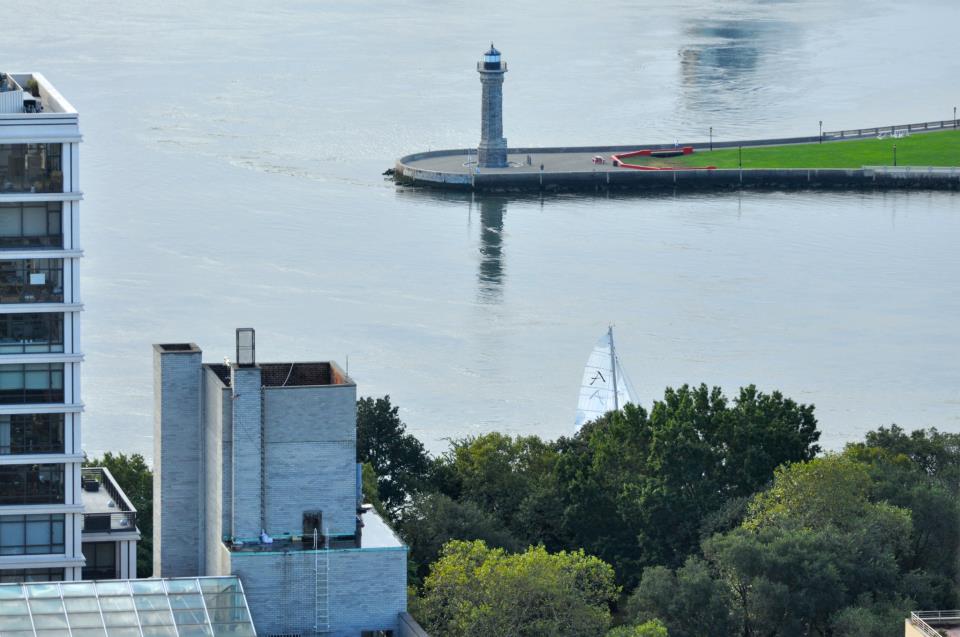
Pre Storm view
“968 millibars now…. wind at 42 knots (gusts shy of 60 knots) tide out now”
“Hells Gate Weather update: Breezy with occasional clouds. 45knots of sustained breeze and 962 millibars. Apartment building noticeably swaying so headed to the second floor gym for a workout. Avoiding all my north and eastern facing rooms and glass is flexing menacingly. South facing rooms are like being on the deck of a ship but much calmer. High tide coming at midnight for hell’s gate.”
“wind speeds that i am quoting are from the weather station. I am sure its blowing harder on our balcony but thinks it is not a good idea to go out there with my anemometer.”
“NEW RECORD. Apartment rocking so hard that sliding closet door is opening a closing on its own. Lucky I still have power as the downtown gang is out of power. Fireman are launching boats on ave a. go away sandy!”
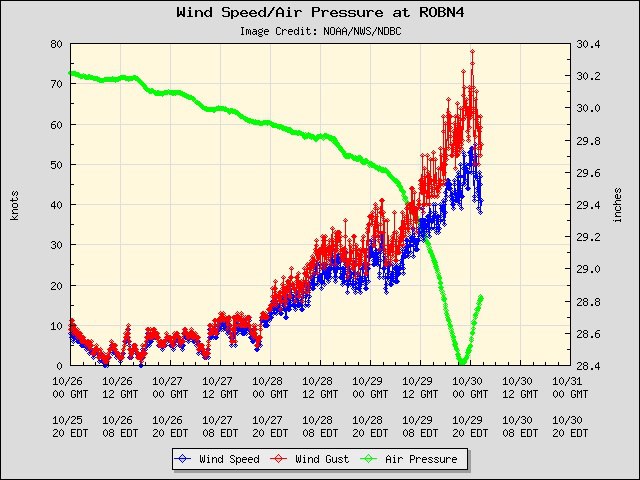
weather data
The worst in terms of wind and barometer are over for the Upper East Side? I really hope all are safe. Winds are a mere 40 knots sustained. Heard the water rose almost to the front door of the bank. Does that mean the gold at the Fed is under water? Now I would go bobbing for those apples.